


Most reports are in, so let’s take a quick look at how 2021 turned out for the global custodians. Numbers indicate growth at around 12 percent for assets under custody, and about 5 percent for the services fees they generated.
[Tables updated in February 2022 with 4Q numbers for BNP Paribas, with text otherwise unchanged.]
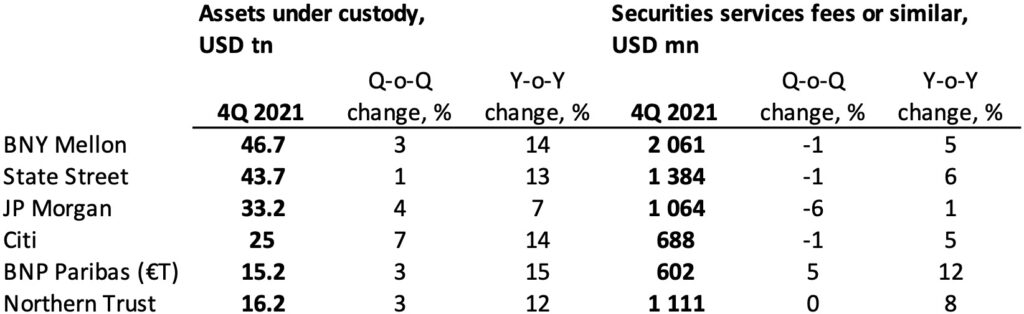
Let us start with the league table by order of the firms’ reported amounts for assets under custody and usually including assets under administration (AUC/A). Note that the numbers may represent more or less different measurements, so don’t assume that they are truly comparable across the companies – but they should give some idea about proportions and growth trends.

Fourth quarter 2021
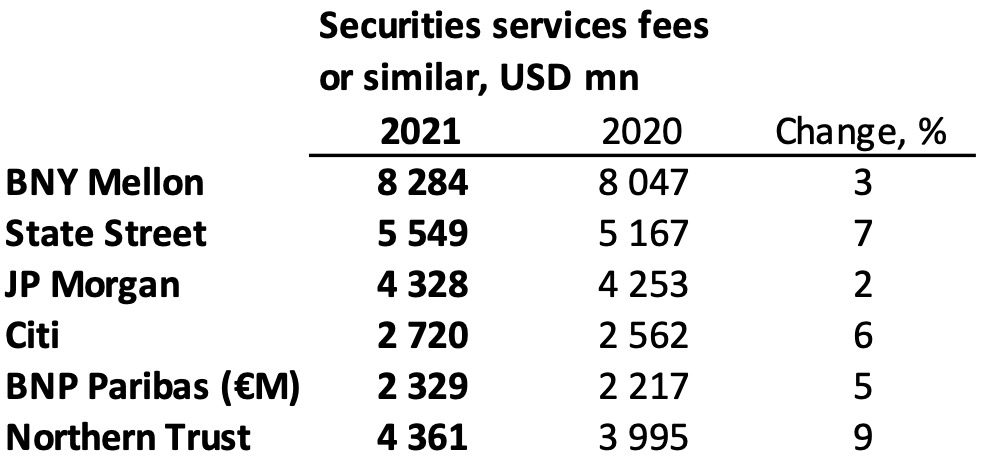
Full year 2021
In 2022, State Street has a good chance of passing BNY Mellon as the top custodian in terms of assets under custody, as it is the process of acquiring the investor services business from smaller colleague Brown Brothers Harriman (BBH). That is likely to add over 5 trillion dollars for State Street.
Fees-to-assets keep shrinking
Generally, we can observe the big difference between the growth rate in assets (totalling about 12 percent, judging by the numbers in our list) versus a 5-percent-or-so growth in servicing fees. This appears to follow the industry’s megatrend of shrinking fees-to-assets ratios – under increasing competition, consolidation and tech-boosted efficiency-seeking. However, the year’s spectacular growth in market asset prices could obviously have played its part too (with the MSCI World index adding 22 percent, for example).
What the actors choose to highlight
For 2021, BNY Mellon says its 14-percent increase in AUC/A is “primarily reflecting net client inflows and higher market values, partially offset by the unfavorable impact of a stronger U.S. dollar”. The major part of the AUC/A amount, $34.6 trillion, was reported within the Securitites Services business segment, while $11.8 trillion was filed under Market and Wealth Services.
BNY Mellon lists some key drivers behind its securities services results. For Asset Servicing it notes that “the year-over-year increase primarily reflects higher activity from existing clients, higher market values, strategic equity investment gains and net new business, partially offset by higher money market fee waivers and lower net interest revenue”. In Issuer Services, however, a “year-over-year increase primarily reflects higher activity from existing clients, higher market values, strategic equity investment gains and net new business, partially offset by higher money market fee waivers and lower net interest revenue”.
State Street, in its report, prides itself with record servicing wins of 3.5 trillion dollars during the year. Notable events, beside the BBH Investor Services takeover, include the launch of State Street Digital. Summing up its fourth-quarter highlights, State Street points to “servicing wins of $205B and new business yet to be installed of $436B at quarter-end”.
Citi saw Securities Services revenues go up 5 percent year-on-year, as “strong growth in fee revenues, driven by higher settlement volumes and assets under custody, was partially offset by lower deposit spreads”.
HSBC claimed strong growth
Global-custody actors below the top-six list include HSBC, Caceis and Societe Generale Securities Services (SGSS). HSBC has not yet reported its final quarter of 2021, yet stated in its 3Q report that it had then seen the assets under custody grow by 23 percent year-on-year in the Securities Services line of its Global Banking and Markets business.
As for BNY Mellon’s fee income numbers in our table above, we have this time shifted from listing total fee revenue to zooming in on “investment services fees”, which make up roughly two thirds of the former. The numbers are thus smaller than ones we have listed on previous occasions. Overall, this ought to make the numbers better comparable with those of the other companies, which often represent fee income specific to securities services divisions.