


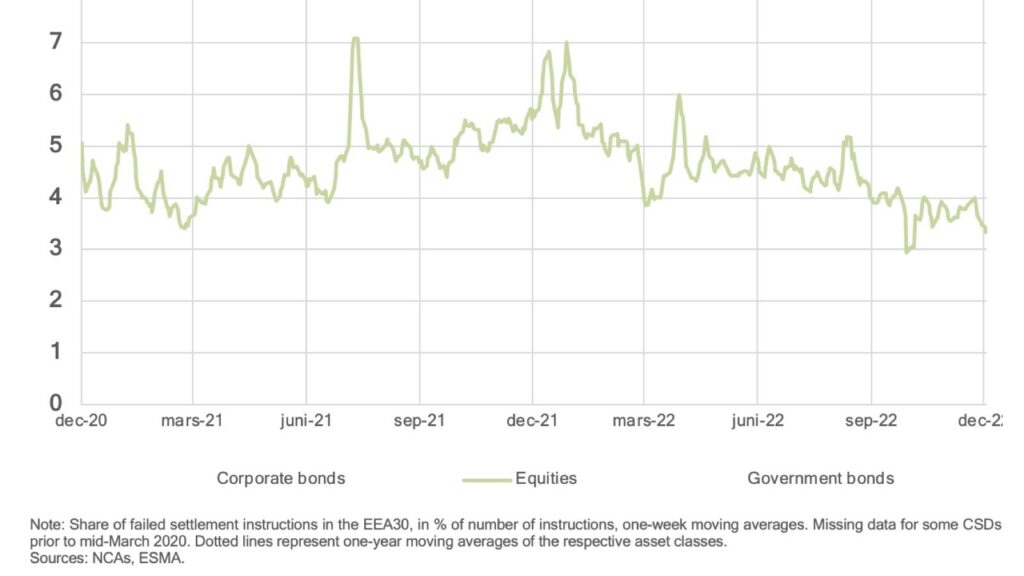
Anecdotes appear to have been false. Current data from EU securities authority ESMA indicates a clear downwards trend in equity trade settlement fails within the 30 countries of the European Economic Area, through 2022 – the first year with fines against those who cause them. From oscillating around 6 percent of the total number of trades at the start of the year (and peaking at 7 percent), the fail rate came down to consistently under 4 percent in the fourth quarter.
Through 2022, conference panels on fail rates were often gloomy: seeing them stuck at high levels or even getting worse (as was the impression from this Sibos panel, for example). With the new penalties under the CSDR settlement discipline regime, since February 2022, this would be extra painful.
Aggregate statistics from ESMA, however, reaching into the beginning of December 2022, now gives a much more positive image – at least when it comes to the equities trade settlements, which make up a larger number of trades than either of corporate bonds or government bonds.

So let’s look a bit more in detail into what the numbers are saying – for each of those three asset classes, and whether we look at the number of trades or the value that they amount to when summed up. From ESMA, we have received data, with diagrams. At PostTrade 360°, we have had a go at adjusting those diagrams somewhat, visually, with the result that you see with this article. For the main image, it is us who have taken out the curves for the bonds to highlight the downgoing fail rate for equities.
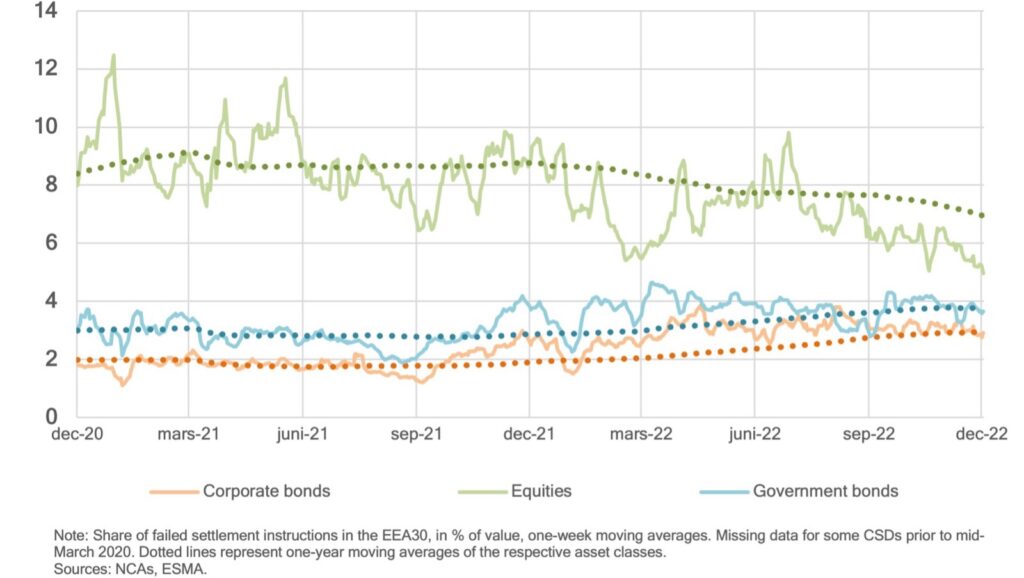
As is apparent from this inline graph above, with curves in three colours, the settlement fails for bond trades have gone the opposite direction – getting worse – reflecting in the blue and orange curves that show upward trends. This diagram is based on the value of the trades, while the equities-only curve in the main image is based on the number of instructions. The failed proportion of value is a higher percentage, following logically from the fact that failed settlements come from larger trades than successful ones do on average.
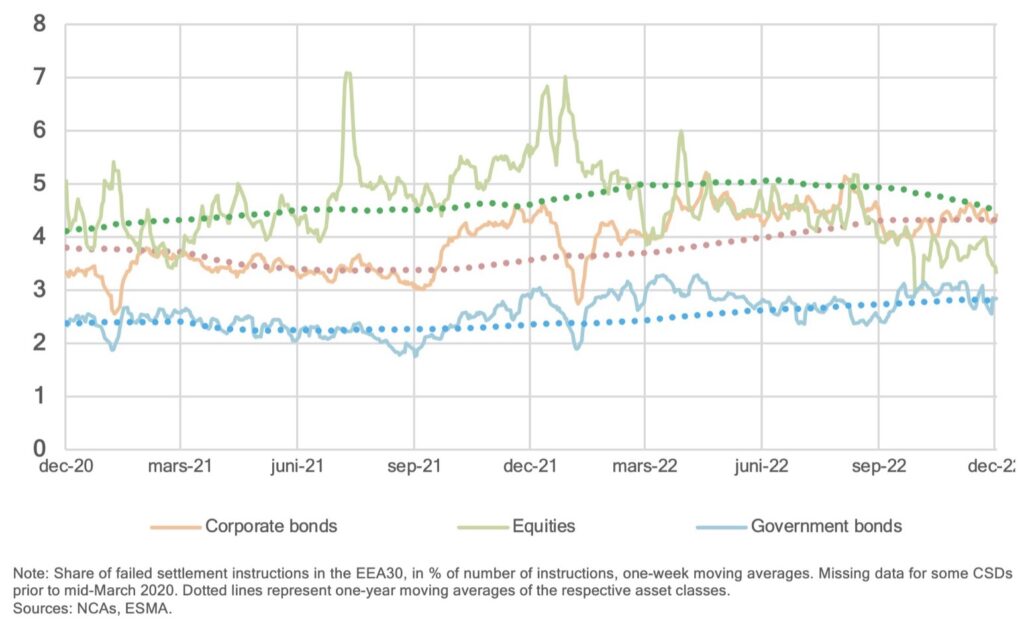
Below is the representation of fail percentages by the number of settlement instructions, for all three asset classes in question.
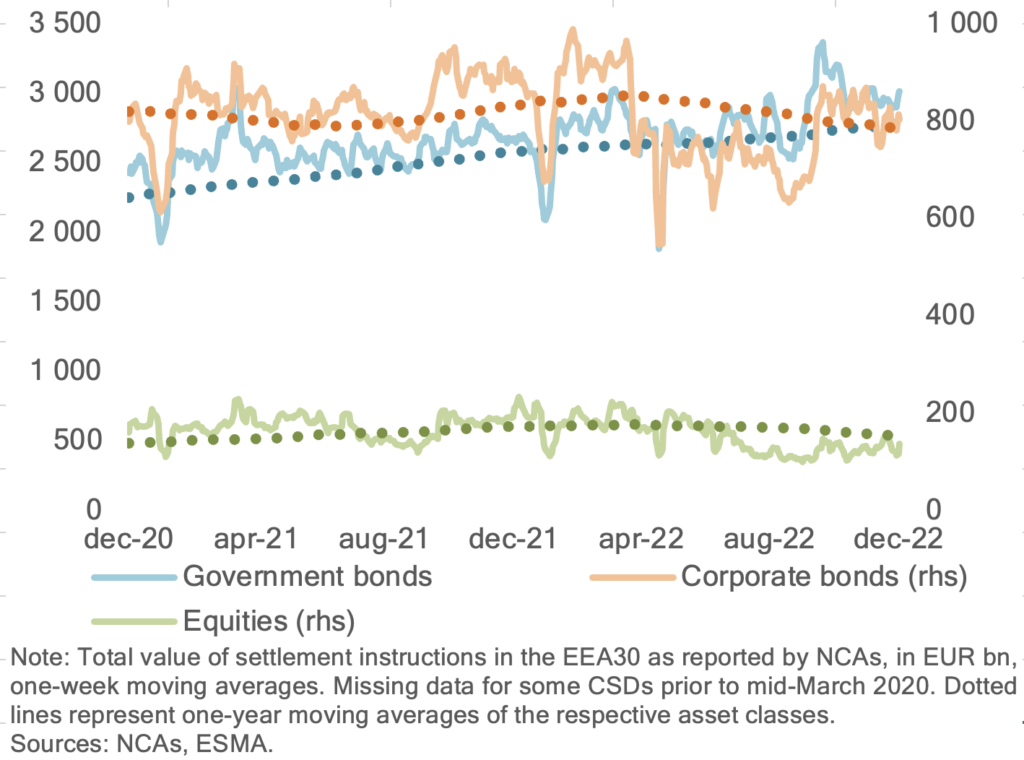
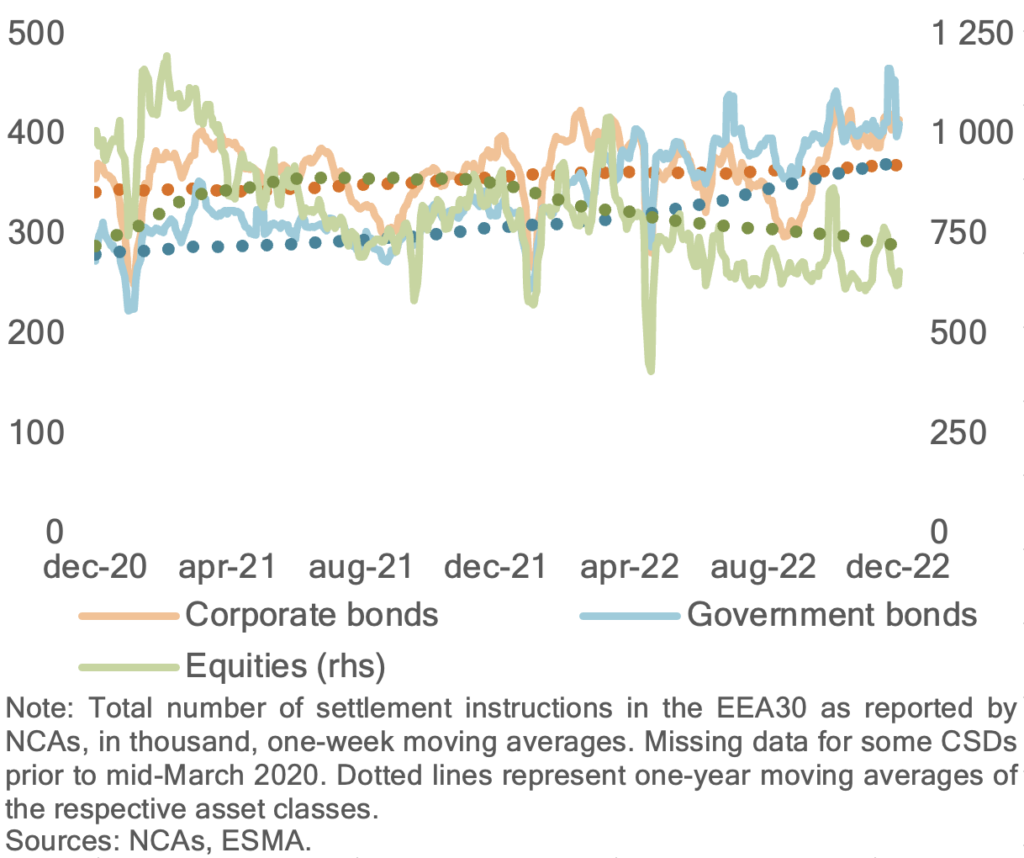
So far the relative proportion of settlement failures. To give an impression of the absolute numbers and values that the trades amount to, let’s add two more ESMA diagrams. The first one shows that equities is the single category that generates the highest number of settlement instructions. At first look, its green line may seem to have come down below the others, but don’t miss that it measures against its own scale, on the right (with “rhs” for right-hand scale).
In the following chart, which shows the total value of the settlement instructions, it is the blue line for government bonds that has its own scale on the left, and which outshines equities and corporate bonds in terms of value totals, by a large margin.