


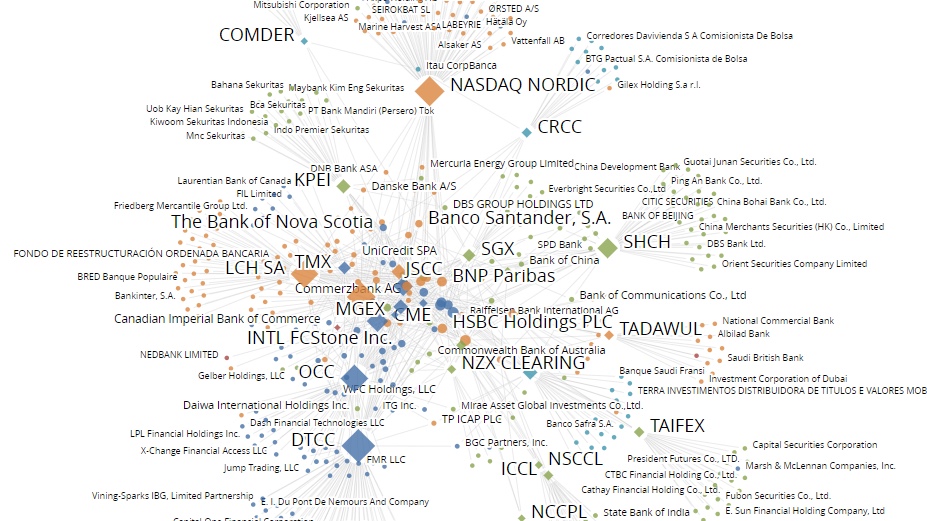
Could visualisations, looking like colour-spotted spiderweb, add insight into the systemic risks that exist in the counterparty clearing relations at the world’s CCPs? A vendor that provides the technology is (perhaps not surprisingly) arguing that it could.
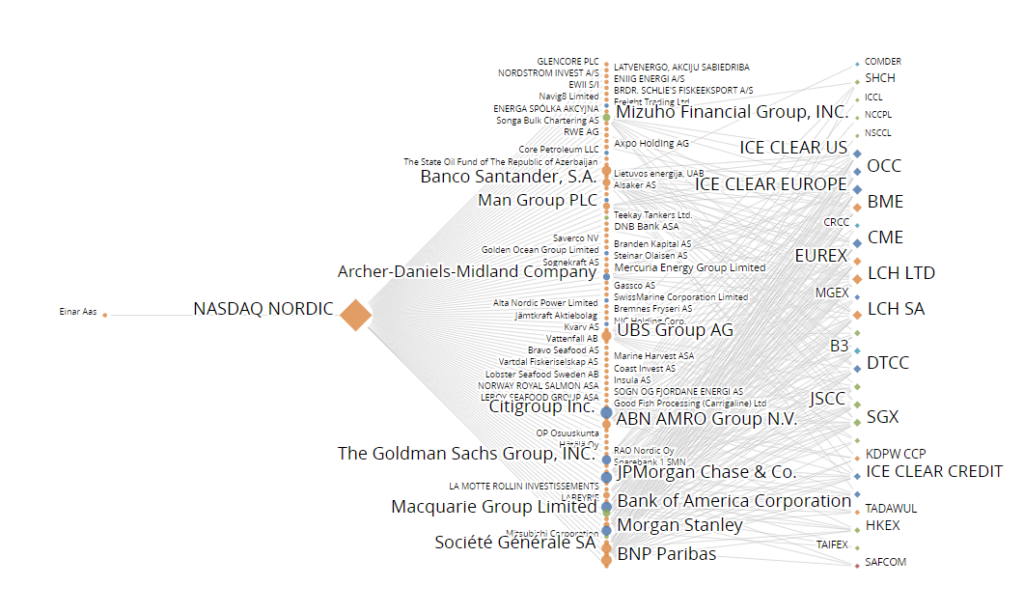
A default in September 2018 – by Norwegian energy derivatives trader Einar Aas, a member of Nasdaq Clearing – sent a shiver down the spines of many CCPs and market participants. Nasdaq took a hit, of course, and so did fellow members who had to chip in as the losses exceeded the CCP’s own reserves. At this stage the collapse was thus contained – but an itching systemic question remained: what if it had not? Could it have triggered a chain reaction infecting members’ other CCPs and the members of those in turn?
The current corona-induced collapse in stock-prices makes the issue of CCP resilience hot again. And representatives of London-based software company Financial Networks Analytics take the opportunity to argue their case: to understand risk in networks it helps to visualise them.

The Aas insolvency was contained, but a network map built from data, on who interacts with whom, helps give a picture of what second tier relations would have been most exposed to the risks in case it had spread. The illustrations here are found in an article by Dave Sissens, FNA’s global head of financial market infrastructures, published on LinkedIn Monday.
An older, more general, FNA-produced article on the topic of visually mapped clearing interdependencies can be found here.
The Einar Aas story has been ambitiously detailed by the New York Times.
[Top image: With diamonds for CCPs and circles for members, technology vendor FNA visualises data it has on interaction patterns in the clearing landscape. Colours represent geographies, and sizes reflect numbers of relations. (Illustration: Financial Network Analytics)]